Discount Cash Flow Analysis (DCF) Discount Cash Flow analysis is a method of asset pricing. Assets are valued at the income they generate discounted to the present. To understand Discount Cash Flow analysis (DCF) it’s important to understand that money received in the future isn’t worth as much as money received now. There are several reasons for this. Here’s an example: If you could have $1,000,000 now instead of $1,200,000 in ten years, you might wait ten years to get the extra 200k. But really you’re making a mistake. If you discount the 1.2 million to now using the 10-year government bond rate (lets assume its 3%) you see that the current value of the 1.2 million is about $890,000:
Government bonds are seen as a risk free investment since the U.S. Government is perceived as being a very solid institution. Essentially, this means you have to invest $890,000 in government bonds now to have $1,200,000 in ten years. The current value of $1,200,000 is $890,000. So basically you have to choose between $1,000,000 and $890,000. Applying DCF to Company Valuation The basic theory behind DCF is that a company is worth all the money that it generates in the future added up and discounted to the present. For several reasons we’re going to be looking at cash flow, to be precise, free cash flow, with DCF analysis. Cash flow gives a much better impression of how good a company is doing. Earnings can be manipulated with accounting tricks, but it’s much harder to fake free cash flow. Here’s how free cash flow (or FCF) is calculated:
Now you have to estimate at what rate the FCF of the company you’re analyzing is going to grow (or decline). There are several ways to go about this, yet there is no right way since all involve guessing. A straightforward method is looking at the FCF over the last couple years and calculating the average growth rate. Of course past performance is no guarantee of future performance but it gives you a good idea of what the growth rate could be in the coming years. Another way to do this is to look at what kind of growth the analysts are expecting. Many financial websites give this kind of information. Companies growing at a rapid pace can’t do so forever. Usually the high growth rate is used in the coming five years and then dropped to the inflation rate in a couple steps. For example: Company X’s free cash flow in 2005 was $205 million. In 2009 it was $736 million.
The company’s average annual growth rate was 38%. The analysts’ consensus is that earnings will grow 32% next year. Now lets say it continues growing at 32% per year for 5 years, then drops to 20% in the sixth year, 12% in the seventh, 7% in the eighth, and 4% in the ninth. Then it stabilizes at 3% year. 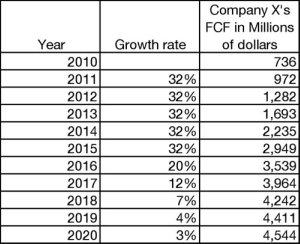 Calculating the Discount Rate Now you have to find the discount rate for this company. This is essentially the return investors want for investing in this company, to some known as the Cost of Capital. An easy way to calculate this is using the Capital Asset Pricing Model (CAPM). The CAPM assumes there is a risk-free return, and a risk premium. The risk premium is the extra return you receive for taking the extra risk for investing in this asset. Here is the formula for CAPM:
Discount rate = risk-free rate + (expected market return – risk-free rate) * stock’s beta coefficient
You have to estimate the market return, but that’s not very difficult when you look at the long-term return. A long-term return of 8% or 9% per year is pretty standard. The risk-free rate is the same as the return on a long-term (30-year) government bond. You can get stock’s beta from just about any financial website. The stock’s beta is essentially the correlation of the stock with the market as a whole. A beta of 1 means the stock moves exactly in sync with the market, a beta of 2 means its twice as volatile etc. The higher the beta the riskier the stock is perceived.
So lets say Company X’s beta is 1.3, and the 30-year government bond return is 3.8% the discount rate should be:
The Final Calculation Now you’re done with all the estimating, on to the final calculation. What you’re going to do now is discount all the future cash flows to their present value. If you have Microsoft Excel or a similar program its fairly simple. Make a table with the cash flows like we did earlier, except go 100 years or so in the future. Now make a fourth table, this is where we’ll discount the cash flows.
This is what your formula should look. For Company X the table looks like this for the first 15 years: 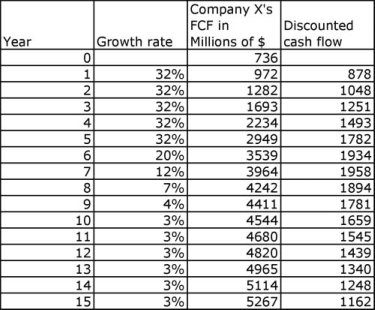 As you can see the Discounted cash flow is at first increasing and then starts decreasing. This is because at first the FCF growth rate is above the discount rate. Once the growth rate falls below the discount rate the DCF starts declining. If you’re using Excel you can just drag down the formulas until the discounted cash flow reaches zero. Then use the SUM formula to add up all the discounted cash flows and, voilà, that’s the value of your company. Another way to go about this is calculating the FCF for the first few of years by hand, until the growth rate is stable. Then take the FCF of the last year and divide it by the discount rate minus the long-term growth rate. This gives you the residual discounted FCF from that year to the future. For Company X the residual FCF after year 15 is about $69,300. Now discount that using the discount rate of year 15 (69,300/(1.106^15)) and add it up to the rest of the discounted FCF received from year 1 to 15 (don’t add up year zero) and you’ll get the intrinsic value of the company. For Company X this turns out to be about $38 billion. Now you can compare this to the market value, or divide it by the number of shares outstanding to get a per share intrinsic value. Lets say Company X has 1.4 billion shares outstanding. The price per share should be $27.14. Compare this to the actual per share price to get an idea of if Company X is overvalued or undervalued. Since DCF analysis requires a lot of estimating I suggest a margin of error of at least 20%. That way if you made a ‘mistake’ estimating the growth rates it could still be a potentially good investment. |