Rate of Change (ROC) The concept of momentum is one of the basics of oscillator analysis. Momentum can be measured by the rate of change of the prices of a stock. The rate of change is found by subtracting closing prices between a set interval. To calculate the 10-day ROC subtract the closing price ten days ago from the latest closing price. These positive and negative values are plotted around a zero line. The formula for rate of change is: ROC = P – Px where P is the latest closing price and Px is the closing price x days ago. Although the 10-day momentum is common, any time period can be used. A shorter period results in more volatility and more sensitivity. A longer period results in a much smoother line that is less sensitive. Buy and sell signals are generated when the ROC line crosses zero. A crossing above zero would be a buy signal, a crossing bellow zero a sell signal. Extremes in either direction hint at overbought or oversold conditions. ROC charts lend themselves well to trendline analysis. Divergences can also be spotted on momentum charts. 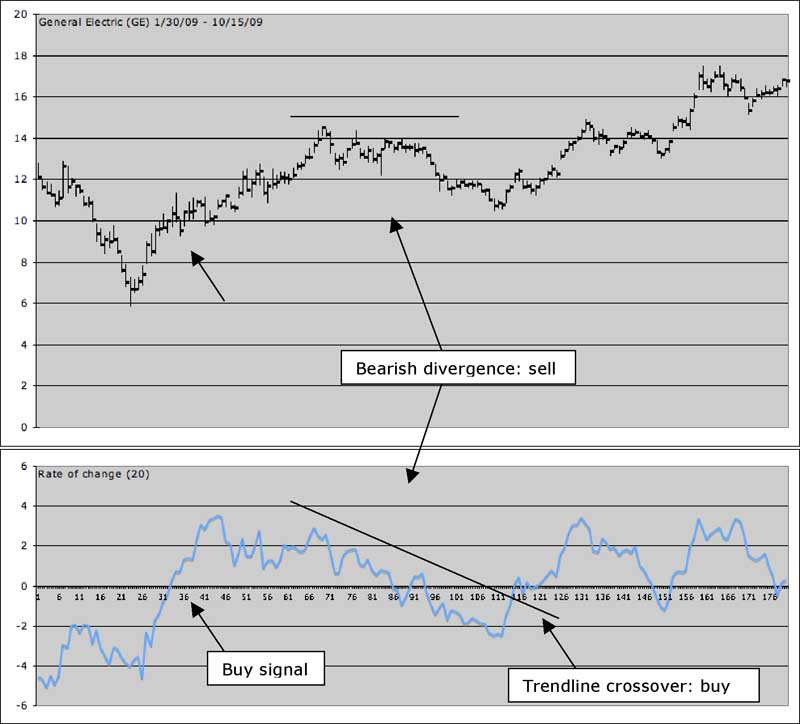
Above is a price chart of the General Electric stock. Bellow it is it’s momentum (20-day rate of change). Buy and sell signals are generated upon crossing the zero line, as well as on divergences and trendline crossovers. |