The Relative Strength Index (RSI) The relative strength index is an improvement on the momentum line for two reasons. The momentum line often shows erratic movement and is affected too much by past data. A price drop ten days ago (when using a 10-day momentum line) can cause a spike in the momentum line now. Furthermore, there is need for a constant upper and lower boundary where the momentum line can oscillate between. Here is the formula for RSI:
Using a 14-day time period this would mean adding the total value gained on up days and dividing by 14. Then adding up all the value lost on down days and dividing by 14. (Convert the value lost to positive numbers.) Then divide the average gain on up days by the average loss on down days. Insert this number into the formula for RSI. The most common period for RSI is 14 days, although a 9-day period is also frequently used. Periods of 5 and 7 days are sometimes used. The lower the period the more sensitive the oscillator becomes and the wider the amplitude. Interpreting RSI RSI values oscillate between 0 and 100. When the RSI line reaches above 70 it is considered overbought. When the line goes bellow 30 it is considered oversold. Since the amplitude of a 9-day RSI line is wider than that of the standard 14-day, the 30 and 70 are sometimes replaced by 20 and 80. Divergence between RSI and price action is also a strong indication that a market reversal is coming. A bearish divergence occurs when price makes a new high but RSI fails to beat the previous high. A bullish divergence occurs when price make a new low but RSI makes a higher low. 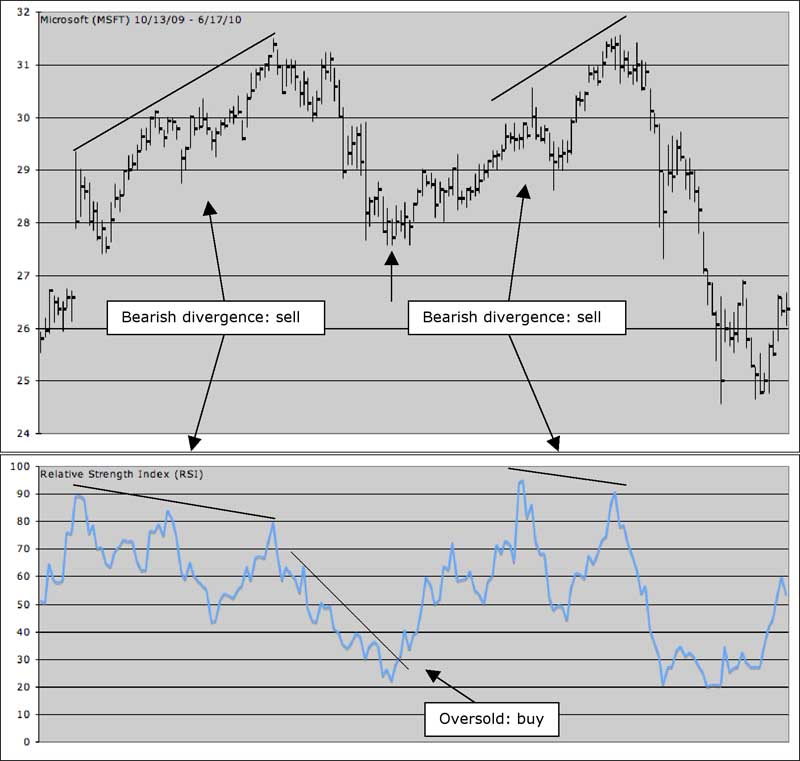
This example shows the power of RSI as it diverges twice correctly notifying of coming bear markets. The buy signal is generated by RSI crossing the trendline, and being in overbought territory. Divergences are the most powerful indication RSI gives. Since divergences don’t always occur at the beginning of a new trend RSI is best used in combination with other indicators. |