Bollinger Bands John Bollinger developed the Bollinger Bands technical indicator in 1980. Bollinger Bands are volatility bands placed around a moving average to define relative high and low. Volatility is calculated by taking the standard deviation of the price action for the same time period as the moving average. The standard time period for Bollinger Bands calculation is 20 days. Because of the nature of its calculation there is no need to change this period for different securities. Several other indicators are derived form the Bollinger indicator; %b and BandWidth are discussed bellow. A 20-day simple moving average is taken of the price action. To create the bands a 20-day standard deviation of the price action is taken. The upper band is created by adding two times the standard deviation to the moving average. The lower band is created by subtracting two times the standard deviation from the moving average.
How to calculate standard deviation: Calculate the average of all the values. Find the difference of each value with the average. Square each difference and add them all up. Take the square root of that number and divide by the number of values in the average. The calculation can be done in Microsoft Excel by using the formula STDEV. %b The %b indicator uses the upper and lower bands that the Bollinger indicator provides to create an oscillator much like the Stochastic indicator. The price is put into proportion with the upper and lower bands.
BandWidth BandWidth is, as the name implies, the width of the Bollinger bands. It measures the difference between the two bands on a normalized basis. This is a measure of how volatile the market is.
Interpretation Contracting bands, which can be easily spotted using the BandWidth indicator, imply that a trend is approaching. Trends that hug one of the bands are strong and will most likely continue. Watch for divergences on momentum indicators to signal the end of such a trend trend. A move outside either band implies that the trend is strong. Unless it bounces back quickly the trend will most likely continue. In a moving market a trend that starts on one band usually ends on the other. This can be closely watched through the %b indicator. 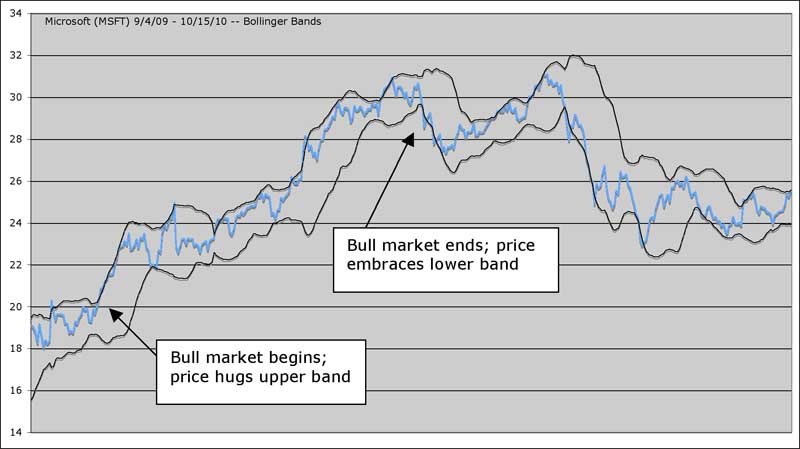 Here an example of spotting trends using Bollinger Bands (20-day standard time-period). A bull market begins as price latches on to the upper band. Price hits the lower band several times but retraces quickly every time, until it holds on to the lower band. This signals the end of the bull market. |