Stochastics (K%D) The Stochastic oscillator is an oscillator that looks at closing price in relation to the price range of certain time period. It is based on the observation that as prices go up, closing prices tend to be at the upper end of the price range. In downtrends the closing price tends to be at the bottom end of the price range. The Stochastic oscillator is built out of two lines, the %K line and the %D line, the latter of which is most important. The most common period for the %K line is 5 days. %K = 100 [ (C – L5) / (H5 – L5) ]C = latest close L5 = 5-day low H5 = 5-day high
The second line (%D) is a 3-day smoothed average of the %K. %D = 100 (H3 / L3)H3 = the 3-day sum of (C – L5) L3 = the 3-day sum of (H5 – L5) Interpreting Stochastics
As with RSI these lines oscillate between 0 and 100. It seems that the best buy signals occur when the %D value is in the 10 to 15 range, the best sell signals occur in the 85 to 90 area. A bearish market occurs when the %D line is above 70 and forms two peaks, the latest being lower than the first, while prices are rising. Conversely, a bullish market occurs when the %D is under 30 and forms two bottoms, the second of which is shallower than the first, while prices are dropping. The actual buy or sell signal is generated when the faster %K line crosses the %D line. The Stochastic oscillator can be used on different time frames, for example weekly or monthly plotted values to get a better idea of the overall trend of the market. It can also be used effectively in intra-day trading for shorter term trading. Slow Stochastics In a slower version of the Stochastic oscillator the %K line is removed. The %D line from the original formula becomes the %K line and a 3-day moving average is added over the new %K line (the old %D line). All this does is it slows down the original formula. It is believed that the slowed version gives better buy and sell signals. 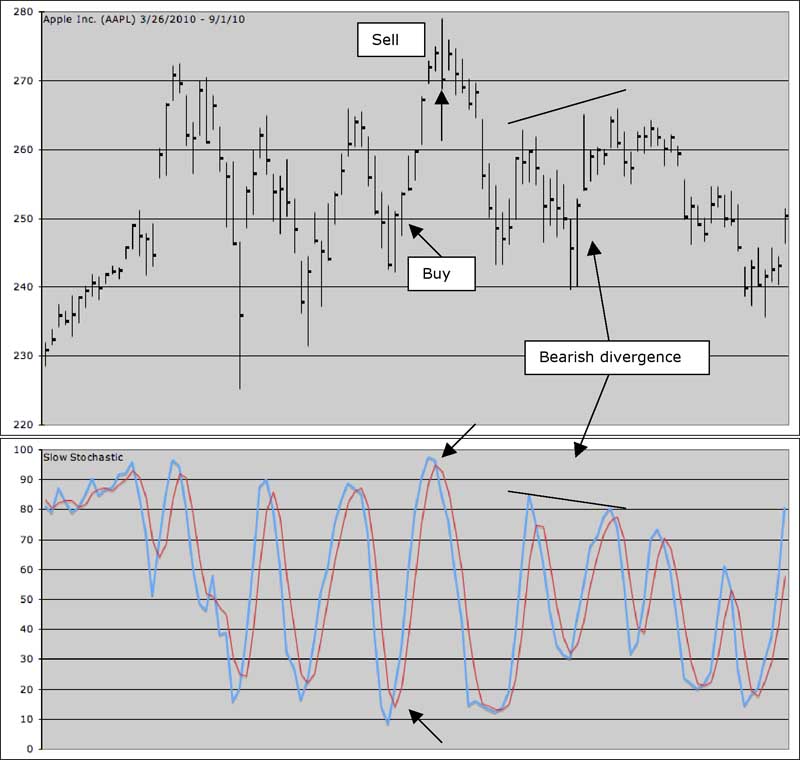
Stochastics are extremely helpful in non-trending markets, as is the case here for Apple. I have shown one buy and sell signal, but of course every crossover of the %K and the %D (red line and the blue line) is a buy or sell signal. The bearish divergence shown in the chart warns of the coming bear market. If one had bought and sold Apple exactly as the Stochastic dictated, buying and selling at crossovers, one would have seen a profit of $60 per share (not counting brokerage fees). This apposed to a profit of only $19 per share using a buy and hold strategy! As is said before, Stochastics work incredibly well in non-trending markets, yet this is compensated by their dismal performance in trending markets. Know when to use Stochastics and they’ll work in your favor, but when a trend starts switch to other indicators. MACD is a good indicator when you are not sure whether the market is trending or not. |