Money Flow Index (MFI) Money Flow Index (MFI) is an oscillator similar to the Relative Strength Index (RSI). It is interpreted in essentially the same way, and also oscillates between 0 and 100. Like RSI the standard time period is 14 days. MFI attempts to track all the money flowing in and out of a security and is thus volume-weighted. MFI basically calculates the total value transacted on a day and gives it a positive value if the price increased and a negative value if the price decreased. The Typical Price is an estimation of the average price people bought the security for on that day. Typical Price = (Day high + day low + day close) / 3 The total value transacted must be calculated: Value transacted = Typical Price * day’s volume The positive money flow must be compared to the negative money flow:
Finally, the Money ratio can be inserted in the following formula to give a constant upper and lower boundary.
Interpretation As stated above, the interpretation of MFI is much like that of RSI. A stock is considered overbought when MFI reaches 80. An oversold reading is given when the MFI hits 20. Divergences and trendlines can be effectively implemented on MFI. If the stock price is declining while money flow is rising there is less trading volume present in price drops than in price gains. This is evidence of a weak downtrend that is likely to reverse, as money flowing into the stock is stronger than money flowing out of it. 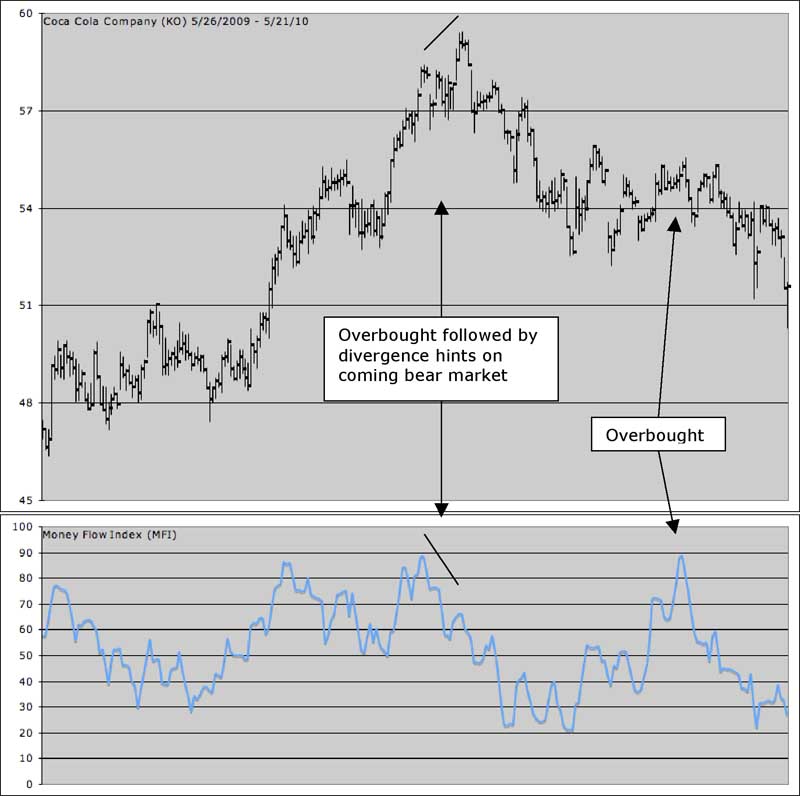 |