Moving Averages The moving average is one of the simplest and most useful tools for the technical analyst. A moving average as the name implies is the average of past price data. For example a 10-day moving average of closing prices calculated by adding up the closing prices of the last ten days and dividing by 10. The average is plotted on the last day of the period it covers. This is known as a simple moving average. The moving average is a trend following device. It tracks the movement of a trend and notifies when a new trend has started. Unlike other technical instruments the moving average does not attempt to predict future price action, it only notifies when a new trend begins. When the moving average is above the stock price the market is bearish, and when the stock price is above the moving average the market is bullish. This can be translated to a buy or sell signal when the moving average and the price data cross. The next obvious question is what period should be used. The shorter the period the earlier you are notified of a changing trend, yet also the more false signals are generated. The longer the period the longer it takes to generate a signal, but there are fewer false alarms. There is no correct answer as to how long the period should be, yet the most common are 10, 20, 50, 100 and 200 days. 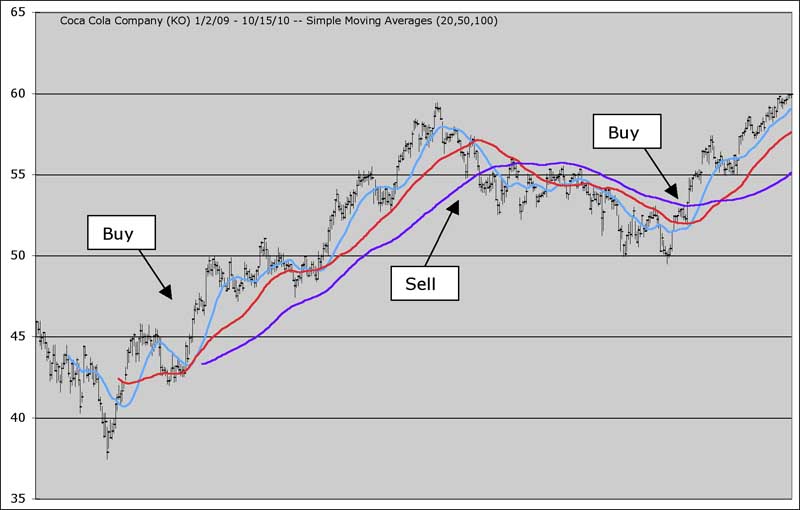 Here are three moving averages of 20, 50 and 100 days. The buy and sell signals in this example are generated by the 100-day line (purple). The 100-day line lags behind much more than the 20 and 50-day lines, (blue and red) but gives less false signals. Some don’t mind a lot of false signals and prefer to use the 50 or 20-day line instead because new trends are spotted much faster. Read the article What is the best moving average period? for more information. |