Unlike other technical indicators, for example RSI, the moving average gives extremely clear signals. There is really no interpretation required which means it can be easily computerized. I put an SMA on the historical prices of the S&P 500 (from 1950 to 2010) and let Excel calculate the average return that would have been achieved over this 60-year period if stocks were bought and sold exactly as the moving average dictated. This was done for many different SMA periods. Results are shown in the table. Note that brokerage fees are ignored.
As you can see, the period length makes a big difference in the return. For example, a 130-day SMA generates a return of 6.6%, whereas a 175-day SMA generates a return of 7.5%. That 1% makes a big difference when compounded over time.
It actually turns out the 2-day moving average gives the highest return, 12.2% annually! The annualized market return for the same period was only 6.9%.
However, with a 2-day SMA, trades happen roughly every two days, resulting in high brokerage costs.
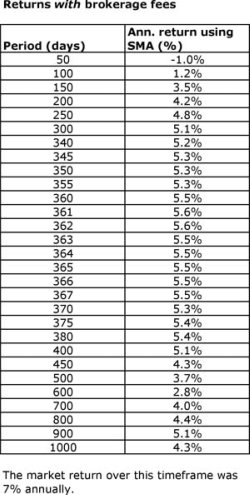
I redid the calculation incorporating a 0.5% brokerage fee at every transaction. As can be seen in the second table, it’s amazing how devastating such a seemingly small fee can be for the average return.
The highest return was reached with an SMA period between 360 and 365 days. When using these averages the return maximizes at 5.6% annually. The market generated a return of 7% annually in the same timeframe. This is somewhat of a disappointment as it shows that you can’t beat the market (or at least, the underlying security) using only simple moving averages purely because of brokerage fees.